风湿模型研究,为什么要检测自主行为?
2020-11-301030文献来源

研究背景
类风湿性关节炎(RA)是一种以慢性滑膜炎和关节骨破坏为特征的自身免疫性疾病。这些病理表现,极大降低了RA患者的生活质量,主要是由于运动障碍以及与疾病相关的疼痛。抗风湿药物如生物制剂和JAKYZ剂能很好地控制关节炎症和畸形,但许多RA患者对疾病的主观评估往往与医生的评估不一致,特别是在疼痛主诉方面,尽管药物ZL之后关节症状有所改善,但患者感受疼痛仍然持续存在。
在迄今的大多数类风湿性关节炎非临床研究中,机械刺激引起的逃避反应被用作疼痛的衡量标准。然而,当评估RA疼痛相关症状时,这种方法有两个显著的局限性。首先,患者所描述的疼痛通常发生在休息或日常生活活动中,不一定与有害刺激有关。第二,与RA相关的滑膜炎症和关节症状,可能干扰反射性快速逃逸行为,从而降低测量的可靠性和重现性。
为了达到更高的疾病缓解率和患者满意率,优化可用于ZLRA的药物ZL方法,不仅需要评估关节炎的症状,还需要评估与RA实验动物模型相关的疼痛和不适的行为学变化。疼痛相关的自发行为应该与自主运动和环境感觉输入相联系来评估。
研究实验
本文作者使用了两种新方法,用于评估类风湿关节炎(RA)模型中的自主行为。
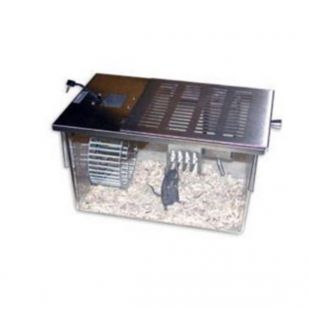
1.把实验小鼠放置在自主活动转轮上评估自发活动,并连续记录转动次数。
2.通过测量区域温度(25 ~ 49℃)和固定温度(25℃)下热板的使用时间和动物探索行为来评估温度偏好。
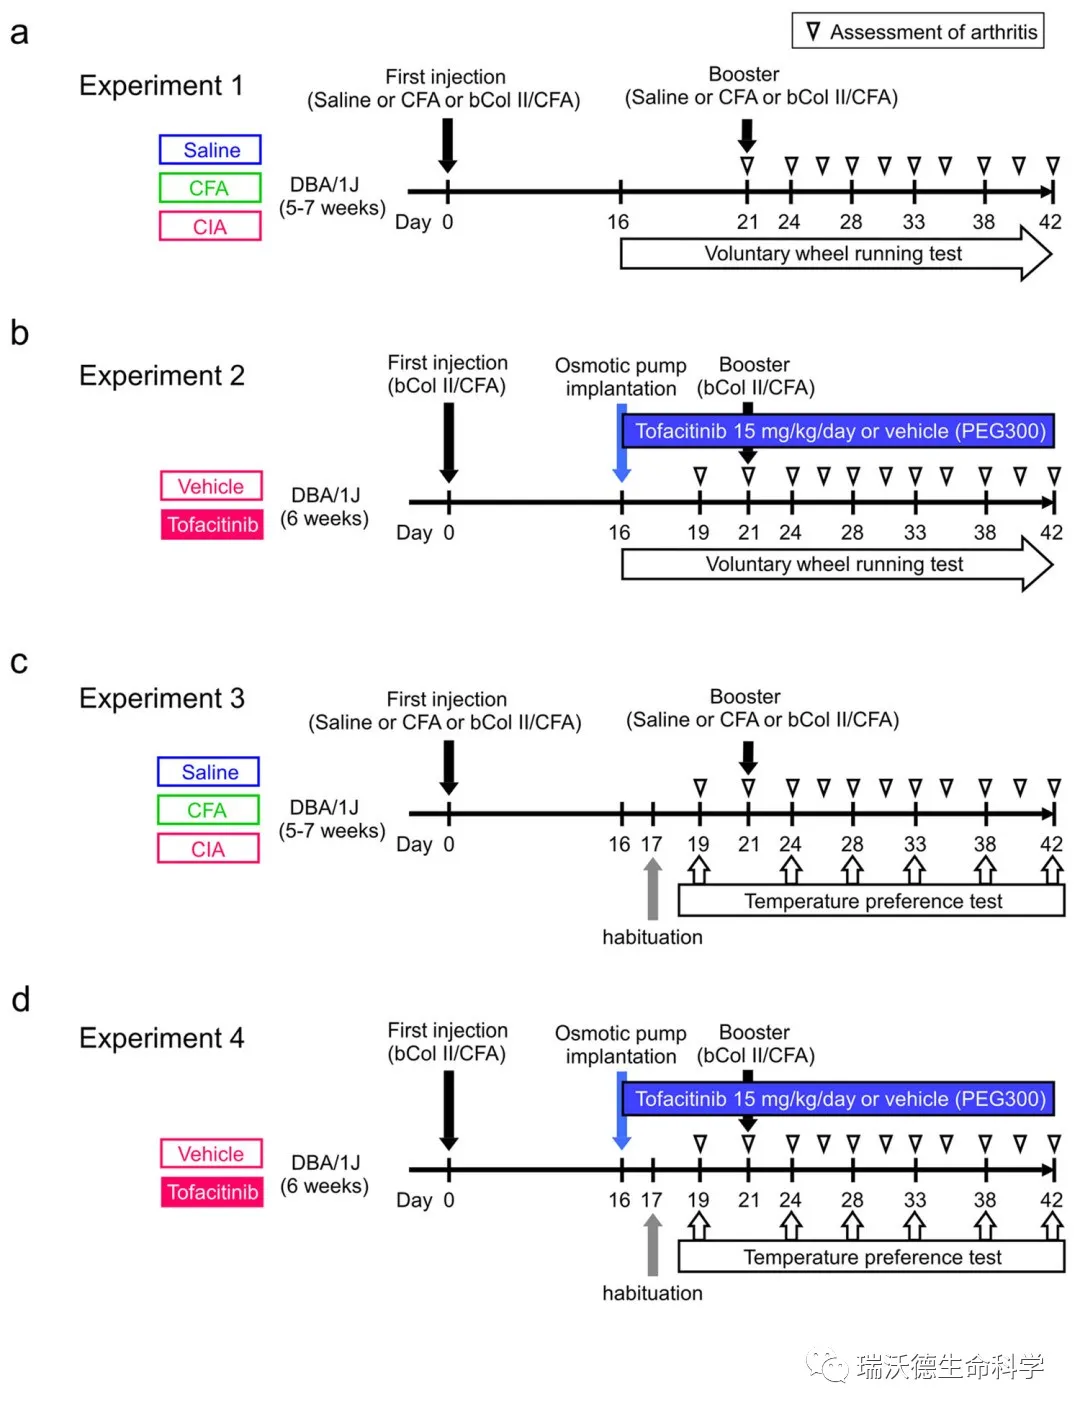
Figure1:Experimental protocols. a Experiment 1. Collagen-induced arthritis (CIA) was induced in mice by a first injection of bovine type II collagen (bCol II) with complete Freund’s adjuvant (CFA) on day 0 and a booster injection on day 21 (black arrows). The control groups were injected with saline or CFA. The mice were single-housed in home cages with running wheels from day 16, and the number of wheel rotations was measured continuously (voluntary wheel running test). The arthritis score was checked on days 21, 24, 26, 28, 31, 33, 35, 38, 40, and 42 (open triangles). b Experiment 2. CIA was induced by a first injection of bovine type II collagen/CFA on day 0 and a booster injection on day 21. The CIA mice received tofacitinib 15 mg/kg/day or vehicle (PEG300) by subcutaneous osmotic pump infusion from day 16 (blue arrow). A voluntary wheel running test was performed from day 16 onwards. The arthritis score was assessed on days 19, 21, 24, 26, 28, 31, 33, 35, 38, 40, and 42 (open triangles). c Experiment 3. Each model was created in the same way as for experiment 1. The temperature preference test was performed on days 19, 24, 28, 33, 38, and 42 (open arrows) after habituation on day 17 (gray arrow). The arthritis score was assessed on days 19, 21, 24, 26, 28, 31, 33, 35, 38, 40, and 42 (open triangles). d Experiment 4. Induction of CIA and drug administration were performed in the same way as in experiment 2. The temperature preference test was performed on days 19, 24, 28, 33, 38, and 42 (open arrows) after habituation on day 17 (gray arrow). The arthritis score were assessed on days 19, 21, 24, 26, 28, 31, 33, 35, 38, 40, and 42 (open triangles)
使用Ⅱ 型胶原诱导的关节炎(CIA)模型进行实验。实验共分为四组:CIA造模组,佐剂(CFA)注射组,生理盐水组,CIA造模+tofacitinib药物ZL组。
在研究中对所有小鼠的关节炎评分进行分析。根据关节炎状态变化的时间进程,作者将观察期分为以下三个阶段:
1.临床前(18-25天;无关节炎体征期);
2.早期临床(第26-34天;评分和发病率开始增加);
3.临床晚期(35-42天;持续高评分和高发病率)。
在临床晚期,CIA组有炎症细胞浸润和典型的踝关节软骨破坏,生理盐水组和CFA组未见。【注:风湿炎症评分-评估关节炎对各肢体临床症状的改变,评分如下:0分,无红斑、肿胀迹象;1分,限于手指、跗骨或踝关节的红斑和肿胀;2分,红斑和肿胀,从踝部延伸到跗骨; 3分,从踝部至跗骨处红斑和严重肿胀】
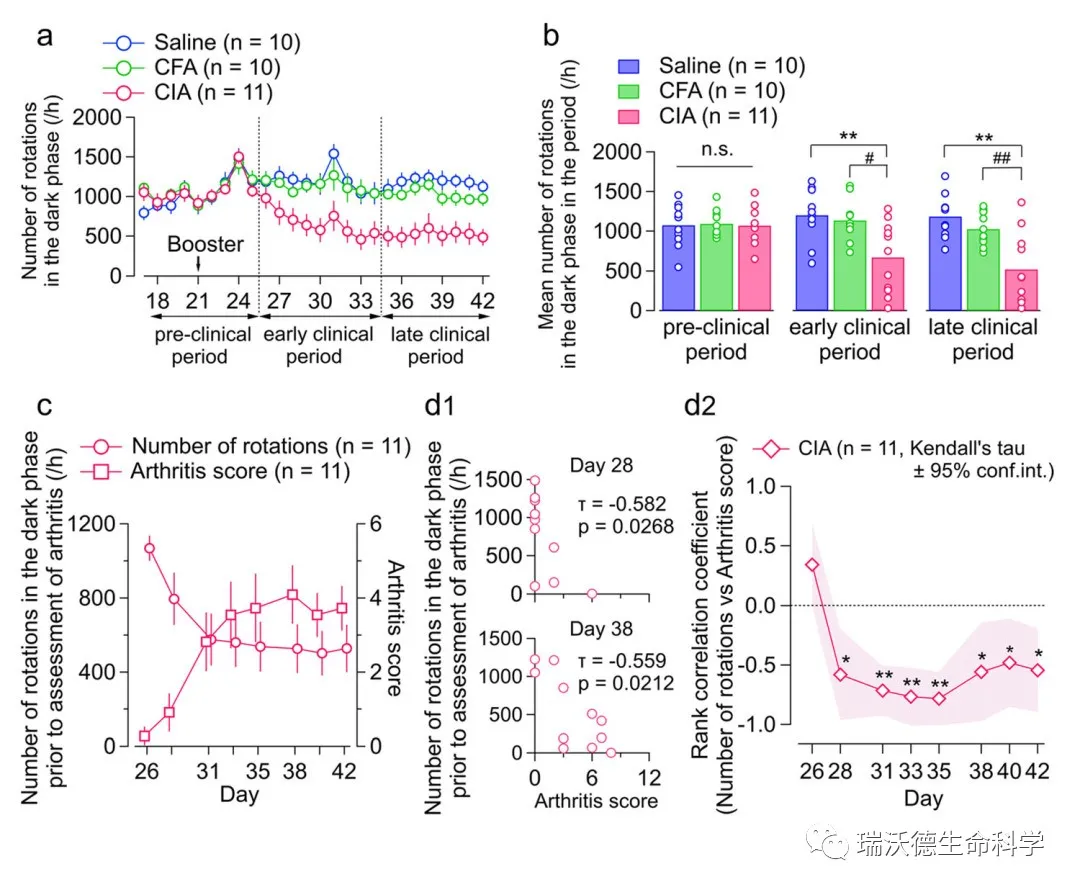
Fig. 2 Effects of arthritis on voluntary wheel running (experiment 1). a Time course of number of rotations per hour in the dark phase in the saline (blue), CFA (green), and CIA (red) groups. The values are shown as the mean ± standard error of the mean. b Mean number of rotations per hour in the dark phase during the pre-clinical period (days 18–25), early clinical period (days 26–34), and late clinical period (days 35–42). The bars indicate the average number of rotations, and each open circle indicates a value from a mouse. *p < 0.05, **p < 0.01, saline vs. CIA; #p < 0.05, ##p < 0.01, CFA vs. CIA, by one-way ANOVA followed by Tukey’s test. c Time course of arthritis score (right y axis) and number of rotations per hour in the dark phase prior to assessment of arthritis (left y axis). Abscissa, days after first injection. The values are shown as the mean ± standard error of the mean. d1 Scatter plots showing the relationship between number of rotations in the dark phase prior to assessment of arthritis (y axis) and the arthritis score (x axis) on day 28 (above) and day 38 (below). The insets show the values for Kendall’s tau and the p value for zero correlation d2 Time course of rank correlation coefficient in the CIA group. The hashed zone indicates the 95% confidence interval for Kendall’s tau. *p < 0.05, **p < 0.01, by Kendall’s correlation analysis. CFA, complete Freund’s adjuvant; CIA, collagen-induced arthritis; n.s., not significant
实验结果
使用CIA模型,作者持续评估小鼠在第16天到42天的自发运动,以分析关节炎的发展如何影响自发行为。在临床早期和晚期,CIA组在黑暗期的旋转次数显著减少。这一下降与CIA组前肢和后肢关节炎评分的增加相吻合,CFA组和生理盐水组的关节炎评分没有任何增加。在大约26天出现关节炎症状后,CIA组的平均旋转次数逐渐减少,在观察期间保持较少的旋转次数,而盐水组和CFA组则没有变化。在CIA小组中,平均旋转数在早期显著小于其他两组。有趣的是,CIA小组的夜间转轮次数的分布也发生了变化,CIA小鼠中,从第23天到第34天,晚期夜间的旋转数比早期夜间减少的更多。这导致夜间运动的时间趋势向较早的时间移动,这表明运动活动的减少在晚期夜间阶段更为明显。
接下来,从第16天开始,通过缓释泵给小鼠皮下输注tofacitinib或vehicle。28天后, vehicle组的后足厚度显著增加(p < 0.01),而tofacitinib组的后足厚度无显著变化。tofacitinib组和vehicle组在第28天之后的每一天的后爪厚度都不同。tofacitinibZLCIA组小鼠的转轮旋转次数在早期显著增加。
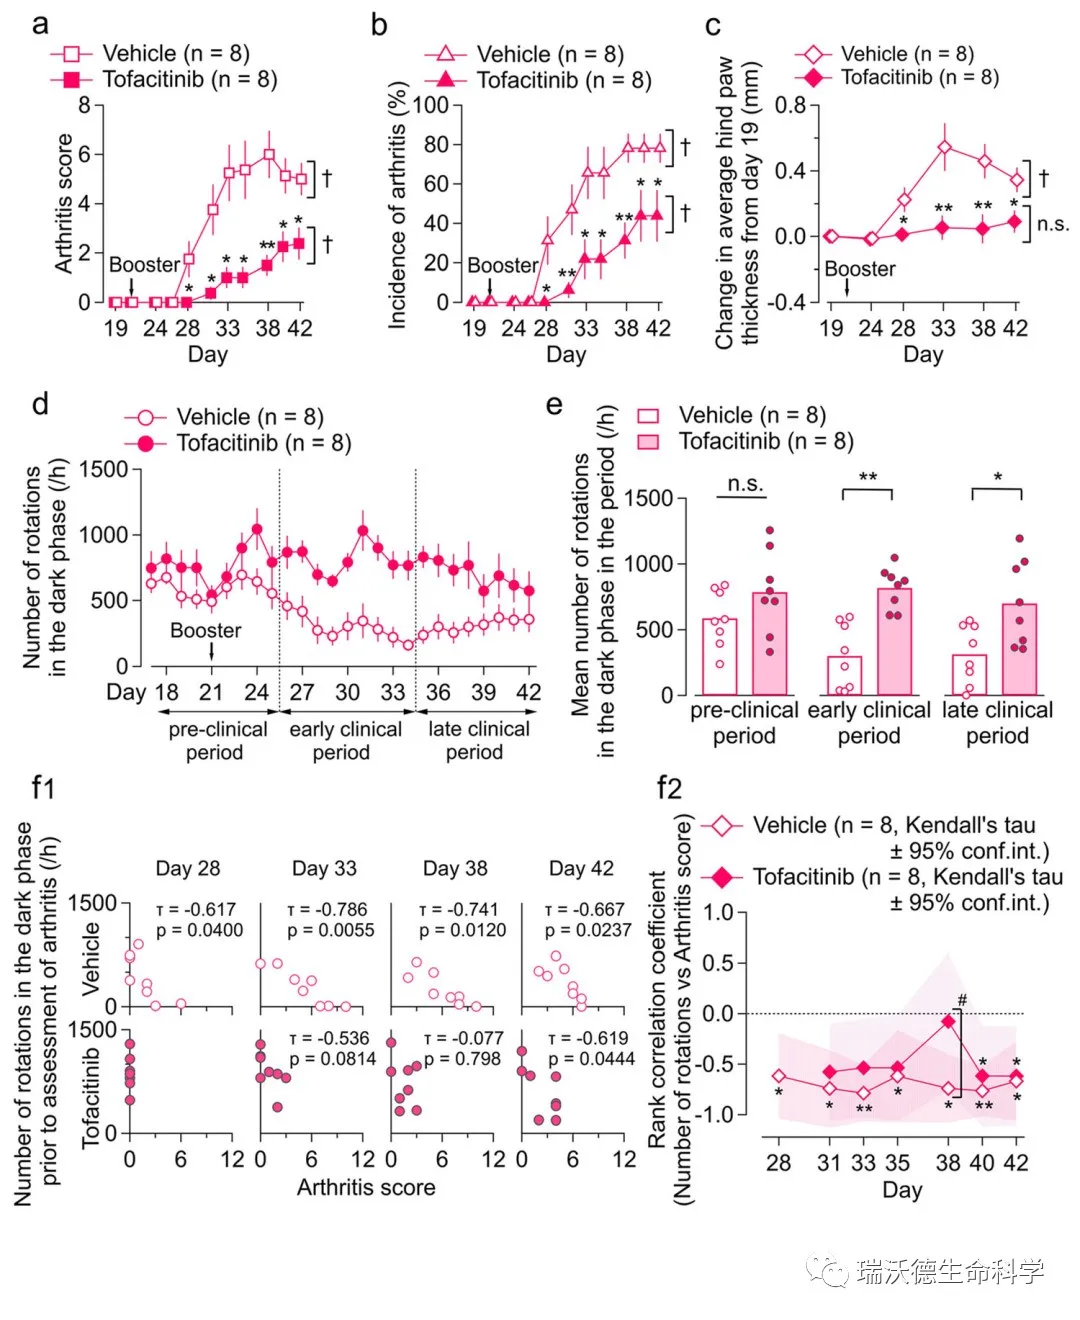
Fig. 3 Influence of tofacitinib on CIA-associated change in voluntary wheel running (experiment 2). a–c Time course of arthritis score (a), incidence of arthritis (b), and change in average hind paw thickness from day 19 (c) in tofacitinib-treated and vehicle-treated CIA mice. Abscissa, days after first injection. The values are shown as the mean ± standard error of the mean. The interaction effects were significant (p < 0.05) by two-way repeated-measures ANOVA in b and c. *p < 0.05, **p < 0.01, tofacitinib vs. vehicle; by the Mann-Whitney U test (a) and Student’s t test (b, c). †p < 0.01; by Friedman’s test (a) and one-way repeated-measures ANOVA (b, c). d Time course of number of rotations per hour in the dark phase in tofacitinib-treated (filled circle) and vehicle-treated (open circle) CIA mice. The values are shown as the mean ± standard error of the mean. e Mean number of rotations in the dark phase in the pre-clinical, early clinical, and late clinical periods in tofacitinib treated and vehicletreated CIA mice. The bars indicate the average number of rotations, and each circle indicates the value for one mouse. *p < 0.05, **p < 0.01, tofacitinib vs. vehicle; Student’s t test. f1 Scatter plots showing the relationship between number of rotations in the dark phase prior to the assessment of arthritis (y axis) and arthritis scores (x axis) in the tofacitinib-treated (below) and vehicle-treated (above) CIA mice on days 28, 33, 38, and 42. The insets show the values for Kendall’s tau and the p value for zero correlation. f2 Time course for rank correlation coefficient between number of rotations and the arthritis score in tofacitinib-treated and vehicle-treated CIA mice. The hashed zone indicates the 95% confidence interval of Kendall’s tau. *p < 0.05, **p < 0.01, by Kendall’s correlation analysis. #p < 0.05, by Z-transform method. CIA, collagen-induced arthritis; n.s., not significant
在哺乳动物中,环境温度是通过一系列瞬时受体电位通道来检测的,这些通道在特定温度范围(17 ~ 43°C)内被激活。CIA小鼠对后爪固定强度的热辐射反应常常表现为置于热板后表现出舔后爪或跳跃行为的潜伏期缩短。作者试图评估动物和人类在日常生活中所经历的非有害环境温度下自发行为的变化。为了达到这个目的,研究人员将实验动物放置在一个环境中,动物可以在室温地板的隔间和有更高温度地板的隔间之间进行选择。
这项研究有趣地发现,CIA组更喜欢中间温度31-43°C,而不是25°C。在观察期间,28天后这种趋势明显可见(图4b)。这一发现清楚地表明CIA作用下小鼠的温度-舒适关系发生了改变。在DY阶段和第二阶段中,小鼠停留时间更长,板间转换减少,这表明小鼠更喜欢待在温度较高的31-43°C的板上,而不是频繁地离开它(图4b)。这种温度-舒适度关系的变化,让人联想到人类RA患者偏爱温水浴(36-37°C),为温水浴可以缓解疼痛,以及传统的spaZL提供研究支撑。由此推测,本研究中CIA小鼠对温暖温度的偏好增加可能反映了动物的主观“感觉”,即较高的温度可以减少伤害性感觉。
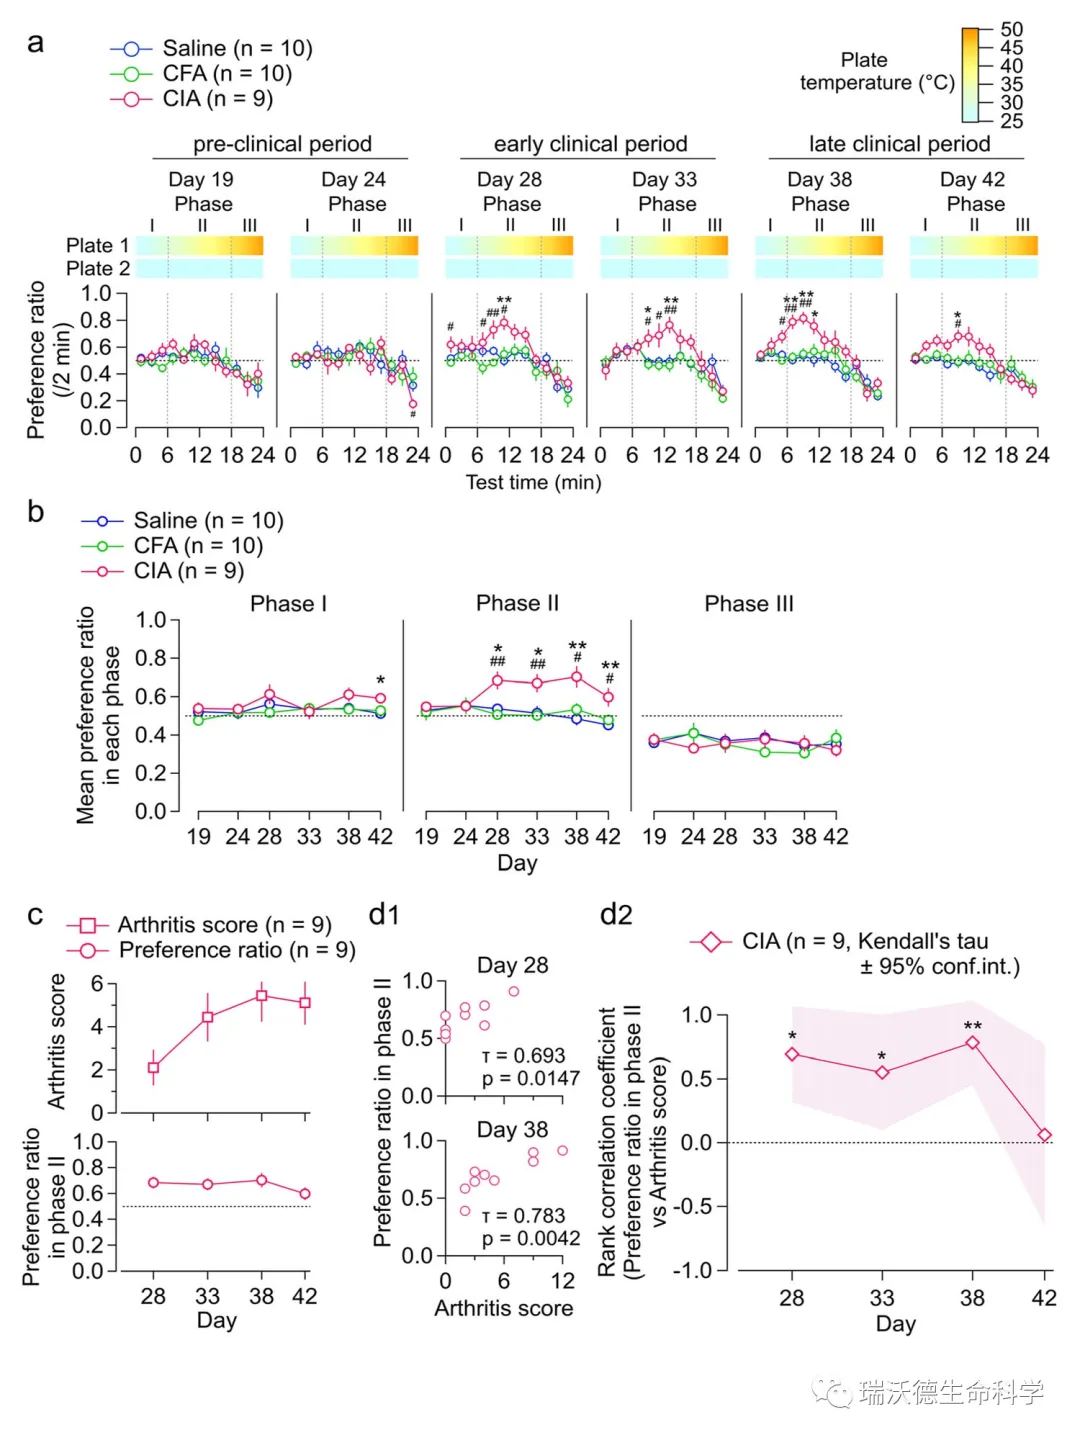
Fig. 4 Effects of arthritis on temperature preference (experiment 3). a Test time-dependent changes in the preference ratio between two plates with fixed temperature (25 °C) and increasing temperature (1 °C/min from 25 °C for 24 min) in the pre-clinical period (days 19–24), early clinical period (days 28–33), and late clinical period (days 38–42) in the saline, CFA, and CIA groups. Ordinate, preference ratio per 2 min; abscissa, test time. The color scale above indicates the temperature of the plate at each time point. The test interval was divided in three phases as follows: 0– 6 min, phase I; 6–18 min, phase II; and 18–24 min, phase III. The horizontal dotted line indicates a preference ratio of 0.5. b Time course of the mean preference ratio in each phase in the saline, CFA, and CIA groups. The horizontal dotted line indicates a preference ratio of 0.5. The values in a and b are shown as the mean ± standard error of the mean. *p < 0.05, **p < 0.01, saline vs. CIA; #p < 0.05, ##p < 0.01, CFA vs. CIA, by one-way ANOVA followed by Tukey’s test. c Time course of arthritis score (upper y axis) and preference ratio in phase II (lower y axis) in the CIA group. d1 Scatter plots showing the relationship between the preference ratio in phase II (y axis) and arthritis score (x axis) on days 28 (above) and 38 (below). The insets show the values for Kendall’s tau and the p value for zero correlation. d2 Time course of rank correlation coefficient for the relationship between the preference ratio in phase II and the arthritis score in the CIA group. The hashed zone indicates the 95% confidence interval for Kendall’s tau. *p < 0.05, **p < 0.01, by Kendall’s correlation analysis. ANOVA, analysis of variance; CFA, complete Freund’s adjuvant; CIA, collagen-induced arthritis
总结
文献S次采用自主行为研究CIA模型中动物相关生理变化,包括自主活动(昼夜)以及特定温度偏好,指标参数与传统的关节炎评分表现出差异性,特别是在药物ZL期间。这些方法的使用也将有助于阐明在RA评估中医患不一致的生物学机制。
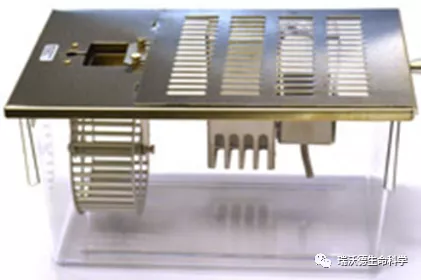
自主活动转轮
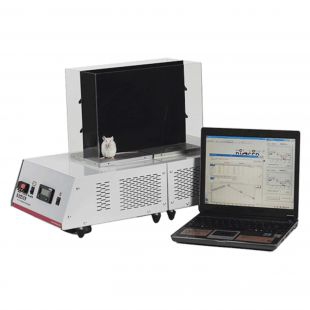
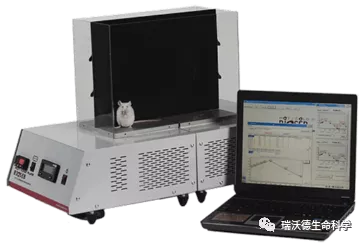
温度位置偏好测试仪
Smart3.0视频追踪系统
(点击图片查看产品详情)
以上就是文献提及的实验方法,关于自主行为检测可不止这些,使用重力感应,红外监测,步态捕捉等技术可以从多角度更加细致的分析动物自主行为。了解更多动物自主行为检测方法,立即扫码查看!

-
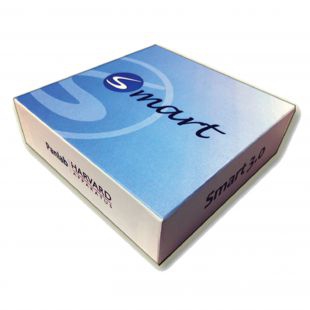
- SMART 3.0小动物行为学记录分析系统
- 品牌:西班牙Panlab
- 型号:SMART 3.0
-
- 自主活动转轮系统
- 品牌:美国Lafayette
- 型号:80859S系列
-
- 温度偏好测痛仪[BIO-T2CT]
- 品牌:法国BIOSEB
- 型号:BIO-T2CT
