企业性质生产商
入驻年限第9年
sisuCHEMA高光谱成像分析系统是一套完整的高光谱成像分析工作站,整合了VNIRSWIR高光谱成像技术、自动扫描技术及高光谱物质分析技术(软件),使用者只需要将放置在样品盘中的待检样品置于推扫台上,即可通过软件进行扫描控制,实时进行光谱二维影像信息的获取和保存,可同时对大量的样品或不同形状的样品进行光谱成像测量分析,包括组成成分/化学组成量化数据及其分布信息等,样品ZD为200x300x45mm,对10mm以下样品其分辨率可达30 μm。
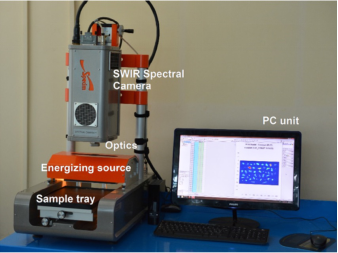
·植物表型组学研究分析
·蛋白组学研究分析
·代谢组学研究分析
·藻类表型研究分析
·种子品质检测、活力检测
·植物病理、病原检测
·中草药检测研究
·根系分析
·食品检测分析
·海洋科学研究
·环境科学
·地质与地球科学
主要技术指标:
VNIR | NIR | SWIR | |
波段范围 | 400-1000nm | 900-1700nm | 1000-2500nm |
光谱分辨率 FWHM | 2.8nm | 6nm | 10nm |
空间分辨率/行 | 1312像素 | 320像素 | 384像素 |
像素大小 | 38 - 152 μm | 30 - 600 μm | 24 - 600 μm |
视野 | 50-200mm | 10-200mm | 10-200mm |
扫描速度 | ZD100行/秒,对应3mm/s@30 μm像素、30mm/s@300 μm像素 | ||
扫描时间 | 320x320分辨率@256波段情况下小于7秒 | ||
照明 | Specim 线性散射光源 | ||
数据格式 | BIL格式,与ENVI兼容 | ||
校准 | 光谱出厂前已校准,每次扫描分析前自动参照标定 | ||
生命科学应用案例:
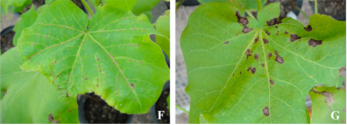
Priscila S.R.Aries、Everaldo P. Medeiros等利用近红外sisuCHEMA高光谱成像分析系统(波段范围1000-2500nm),对棉花炭疽病等病原进行了研究,论文发表在2018年J.Spectral Imaging(Near infrared hyperspectral images and pattern recognition techniques usedto identify etiological agents of cotton anthracnose and ramulosis)
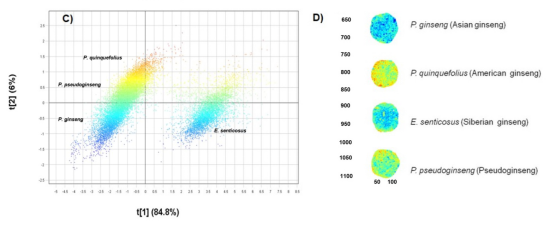
Maxleene Sandasi、Alvaro Viljoen等,利用sisuCHEMA高光谱成像分析技术,对不同品种人参进行了定性分析研究,认为是一种简单快速非损伤性鉴定检测技术。论文发表在2016年Molecules(The Application of Vibrational Spectroscopy Techniques in the Qualitative Assessment of Material Traded as Ginseng)
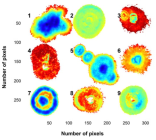
Paul J.Williams等利用sisuCHEMA高光谱成像技术,对镰刀霉属生长特性及其品种差异进行了研究,论文发表在2012年Anal Bioanal Chem.上(Near-infrared (NIR) hyperspectral imaging and multivariate image analysis to study growth characteristics and differences between species and strains of members of the genus Fusarium)。

地质地球科学应用案例:
sisuCHEMA高光谱成像分析技术广泛应用于金属矿产和油气资源勘探研究、环境污染监测分析等。
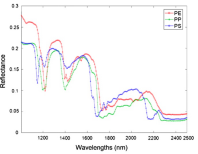
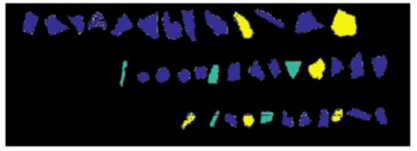
聚丙烯(PP)、聚乙烯(PE)及聚苯乙烯(PS)光谱特征曲线及海洋污染高光谱成像分类监测(黄色为PS、绿色为PP、蓝色为PE),研究论文:Silvia Serranti etc. Characterization of microplastic litter from oceans by an innovative approach based on hyperspectral imaging. Waste Management, 2018
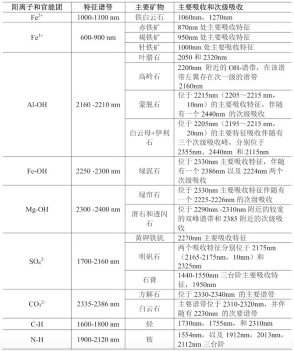
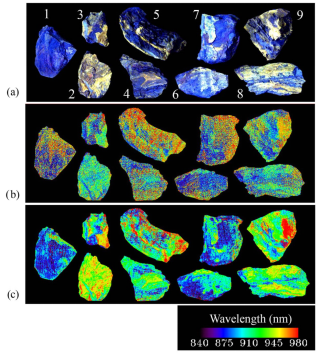
左图: 不同矿物高光谱特征吸收谱带;
右图引自研究论文:Richard J.Murphy etc. Consistency of Measurements of Wavelength Position From Hyperspectral Imagery: Use of the Ferric Iron Crystal Field Absorption at ∼900 nm as an Indicator of Mineralogy. Transactions onGeoscience and Remote Sensing, 2014
